
GIS/OGC Webapplications
Implementing a Geographic Information System (GIS) into the web applications is an extremely important task
in visualizing the impact of human activities on hydrologic characteristics,
and in identifying the effect of hydrologic behavior caused by physical parameters associated with land use change.
The GIS has several useful features that enhance the integration of climate, terrain, soil type,
human activities, and land use change into a comprehensive surface hydrologic model.
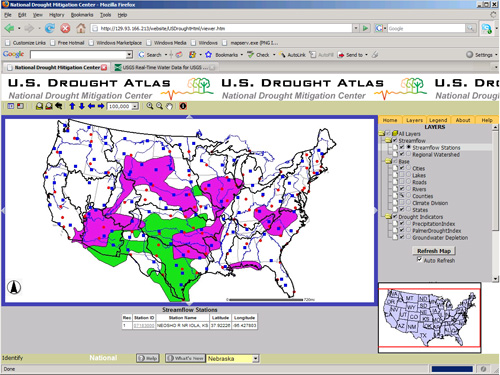
There are two mock-ups using ArcIMS (Comercial software:ESRI) and Mapserver (Open Source software: U. of Minnesota) available here for basic research and class purposes.
The upper figure is the mock-up using ArcIMS, and the lower figure is directed to the mock-up using MapServer (U. of Minesota) and PostGIS as a Geospatial database.
"Visualize water resources data on the web with a state-of-the-art geospatial mapping technology"
The recent advances in web technologies used by Google Maps (http://maps.google.com)
have facilitated the development of more interactive geospatial mapping technologies.
The technology behind these mapping tools is known as Asynchronous JavaScript and XML (AJAX),
which is aimed at more stable functionality, fast interactivity between servers and clients,
and cost-effective data exchanges between the servers behind the scenes.
Although Google Maps fully takes advantage of this recent technology, there are still many restrictions in terms of customization, source modification, and licensing issues.
In this mock-up on the left figure, I propose to use ka-map (http://ka-map.maptools.org/),
which is a very powerful tool for customizing user components such as the graphical user interface (GUI).
Ka-map can be coupled with MapServer (http://mapserver.gis.umn.edu/),
which was developed at the University of Minnesota.
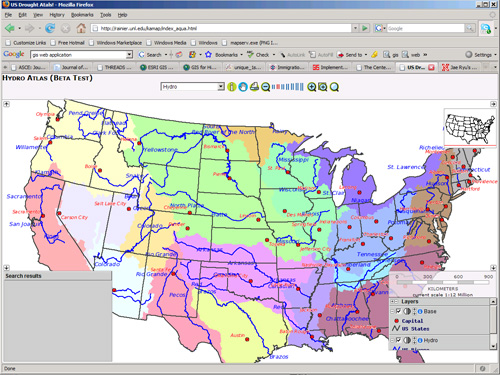 Both ka-map and Mapserver are open source web-mapping technologies, which are compliant with Open Geospatial Consortium (OGC) standards.
All analysis output and dynamic maps of water resources data (snow, water, soil moisture, vegetation, crop yield, and many others) through data processing will be displayed on the web through an OpenGIS framework,
including Web Feature Service (WFS), Web Map Service (WMS), and Geography Markup Language (GML).
Both ka-map and Mapserver are open source web-mapping technologies, which are compliant with Open Geospatial Consortium (OGC) standards.
All analysis output and dynamic maps of water resources data (snow, water, soil moisture, vegetation, crop yield, and many others) through data processing will be displayed on the web through an OpenGIS framework,
including Web Feature Service (WFS), Web Map Service (WMS), and Geography Markup Language (GML).
Additionally, many different image formats of the maps (as users create them on their web browser) can be available, including jpg, gif, tiff, and pdf.
Such visualization and customized maps are very useful to help local decision makers responsible for water resources planning and management on their decision making processes.